Diagnostic
Gratuit
Hedroom lit la pression de la mémoire, le swap, le CPU, la thermique, la batterie et le stockage, puis nomme la seule app qui compte.
The problem
Your Mac feels slow, and Activity Monitor gives you numbers, not an answer. The memory bar is nearly full, which looks alarming, but a Mac that has been on for a while always shows most of its memory as used: macOS fills spare memory with cached files and hands it back the moment an app asks. Used memory on its own tells you very little.
What matters is whether macOS is struggling to find room, and whether one app has grown far past its normal size. Spotting that by eye means watching several graphs for an hour. Diagnosis does the watching, names the one app that matters, or says plainly that nothing needs you.
How it works
- Read. One sampler reads memory pressure, swap growth, CPU, thermals, battery and free storage. It checks every 2 seconds while a Hedroom window or the menu bar panel is open, and less often in the background.
- Judge memory by pressure. The state is Healthy, Strained or Critical, from macOS's own pressure level and how fast swap is growing. Swap that merely exists never makes your Mac Strained. Swap that keeps growing can.
- Learn what is normal. For each app, Hedroom learns a usual size from your last 7 days. Until it has watched an app for about 6 hours, it says it is still learning and uses typical sizes for apps it knows by name.
- Wait to be sure. An app is flagged as leaking only when it is at least 3 times its usual size, at least 1 GB (or 6% of your RAM, if that is larger), and has stayed that way for 20 minutes or keeps growing. A background app that averages 80% of one core for 3 minutes is flagged as runaway CPU.
- Say it once. The finding appears on Today with its reason. Notifications are rationed: the same finding about the same app at most once every 6 hours, and no more than 3 non-urgent ones a day.
What you will see
Today shows one thing: a single suggested fix with its reason, such as an app's name, its size and how many times its usual size that is, or "All good. Nothing needs you right now." The Memory screen adds the pressure gauge, a 60-minute timeline of Healthy, Strained and Critical, the swap rate, what is filling your memory (apps, wired and GPU, compressed, cached files), and every app sorted by size.
The menu bar icon shows the same state, with a small dot when a fix is ready. Apple's own processes get a plain-words explanation and no buttons.
A worked example
Example, not real data
Slack grows over an afternoon
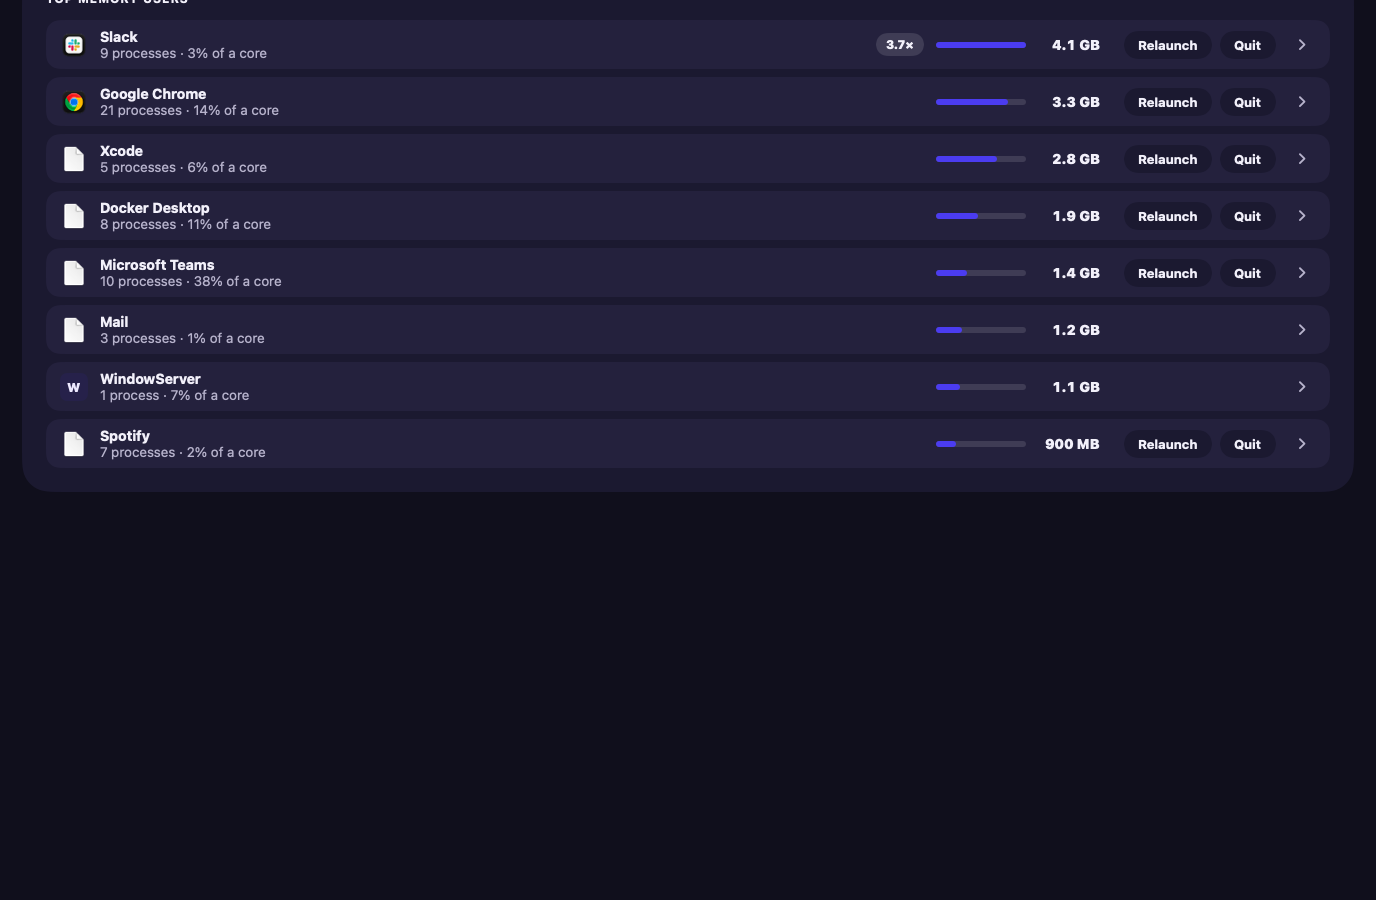
Say Slack usually sits around 1.1 GB on your Mac. After a long call it reads 4.1 GB, which is 3.7 times its usual size, and it has stayed there for 20 minutes. Memory pressure has moved to Strained and swap keeps growing.
Today shows "Slack · 4.1 GB · 3.7× its usual size" and offers to relaunch it, with the reason. Nothing happens until you press the button; Fixes covers what the button does. If pressure had stayed Healthy, the same growth would still show on Today, but you would be notified only from 4 times its usual size.
Details and limits
Ce qu’il fait
- Juge la mémoire d’après la pression de la mémoire et la vitesse de croissance du swap, pas d’après la « RAM utilisée ».
- Apprend la taille habituelle de chaque app sur votre Mac, puis signale celle qui a atteint plusieurs fois cette taille et y reste.
- Explique les processus propres à macOS, comme kernel_task et WindowServer, en mots simples.
- Affiche un résumé dans la barre des menus et vous alerte en cas de fuite de mémoire, de CPU qui s’emballe et de pression critique.
What it will not do
- Afficher un nombre de « problèmes », une analyse alarmiste ou un pourcentage qu’il n’a pas mesuré.
- Faire quoi que ce soit à votre Mac juste en le regardant.
Limits
- Une fuite n’est signalée que lorsqu’une app reste anormalement volumineuse un certain temps (environ 20 minutes par défaut) ; un pic bref n’est donc pas un constat.
- Quand la mémoire est saine, il le dit et reste silencieux. C’est l’état normal, pas une lacune.
Gratuit ou Pro
Gratuit pour toujours.
Reading your Mac changes nothing, so it stays free. Monitoring, explanations, alerts and the storage scan are free after the trial too.
Questions people ask
Does it need my admin password or Full Disk Access?
No. Setup asks for neither, and the readings behind Diagnosis need no admin rights. Full Disk Access is asked for only if you later turn on iPhone backups or Mail downloads in Storage.
Will watching my Mac slow it down?
Hedroom's budget is under 0.5% of one core on average and under 80 MB of memory. With no window open and 5-second ticks it measured 0.27% of one core on one MacBook Pro. That is one Mac, not a promise for yours. How it works has the measured figures and their limits.
Does anything leave my Mac?
No readings, app names or usage leave it. The only things that go online are the license check, update checks, a weekly download of the signed process library, and feedback you choose to send. Privacy lists each one.
What if it names the wrong app?
A finding is a suggestion. Nothing is done until you press a button, and you can put any app on your never-touch list, after which fixes and rules skip it. Alerts still show.